
As we head towards the end of summer we have seen an increase in listings across all market areas, while new pending sales took a slight dip. This has caused the month supply of homes to increase, but only slightly. The market supply of homes is still on the low end favoring those who wish to sell their house as prices continue to increase.
SUMMARY
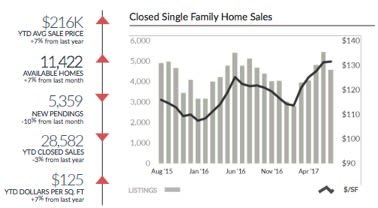
The number of closed transactions in July fell 11% from June sales. This drop is similar to what Southeast Michigan experienced in the market at this time last year when sales droped 12% from June ‘16 to July ‘16. If history is to repeat itself we would see an increase from July to August this year. From July to August of 2016 we saw a jump in closed transactions of 7%. Typically new pending sales are used as an indicator of where the market is heading. Pending sales have dropped 10% over the prior month but there is still a chance for closed sales to see an increase from July to August.

Months supply of inventory has increased as a result of an increase in supply and fewer pending transactions this month. The average months supply is still only 2.1 months across all price ranges, while higher end homes (800k+) are taking a little longer at 12.5 months as there are fewer buyers. There is still a strong demand from homes in the under 200k market as listing agents have been pricing their homes aggressivley to get in multioffer situations for their sellers. Many buyers have missed out on homes this summer and are still interested in purchasing property as we see prices continue to increase.
As supply increases and demand slows down we see the negotiating power start to shift toward the buyer. Homes priced above $800k are taking longer to sell compared to the homes in the low end market, which continue to sell fast. Buyers looking to get into the market below $200k are still seeing high competition for the best homes on the market.
DRILLING DOWN THE DATA
Real estate is local. Cities, communities and even neighborhoods have unique characteristics that either attract or detract from their popularity with buyers. The more people that want to live in an area, the more valuable those properties become.
The county-wide trends of the Housing Report provide a macro view of what’s happening. The Housing Reports are designed to supplement information available to real estate agents by describing larger scale market trends. In counseling, individual buyer and seller clients, agents drill the numbers down into smaller neighborhood areas and price ranges. They do this using comps and other tools available through their MLS data providers. The more localized the data, the more relevant it becomes in fine-tuning the descriptive story.
Let’s use a high-end Birmingham home for an example. Looking at the “over-$800k” Oakland County properties in this Housing Report, we see that heading into August there are 584 available homes, 44 new July pending sales (under contract, but not closed), a 13 month supply of inventory and a $265/SF YTD average sale price. How relevant are those statistics to a buyer or seller making a decision regarding a specific $1.2m home in Birmingham? Can we further refine that information for counseling our client?
Using our multilist searches and available tools like Realcomp’s Infosparks, we can hone in on a specific areas and price ranges. Heading into August there were 33 active Birmingham listings priced between $1m and $1.5m. There were 5 new July pendings, 4 July closed sales, 9 months of supply and a $335/SF YTD average sales price. (The $335/SF Birmingham average is significantly more than the $265/SF county average.)
With this more targeted data we see that Birmingham homes in this price range sell faster and for a higher average $/SF than other “over-$800k Oakland County” homes. This information would be helpful to a seller who is pricing their home or a buyer who doesn’t pay more than necessary, or worse–lose the home of their dreams to a competing offer.
Drilling down is equally relevant for $200k Ferndale or $100k Roseville properties. An agent armed with more local and price-specific data is better equipped to help their clients make better decisions.